The Carlson add-on to the Autodesk AutoCAD software is a powerful tool in the mine planning and mine design portion of mine engineering for a site. Burgex utilizes several modules of the Carlson software when evaluating current and future mine/quarry locations. The process can vary from site to site as location circumstances change and the level of information given or needed varies greatly. Sometimes it is only necessary to design a haul road to calculate cycle times for determining mining rates and costs. Others may require more in-depth engineering, such as a block model design and ore grade mapping. Burgex can provide as much or as little detail as needed by clients. This article will show the detail levels that go into a feasibility deep dive from start to finish.
The first step to any project is to get the site’s data; this usually comes from geologists, drillers, other engineers, on-site visits by Burgex, and others. This data can come in many forms. The absolute necessary data is drill hole logs and a surface file.
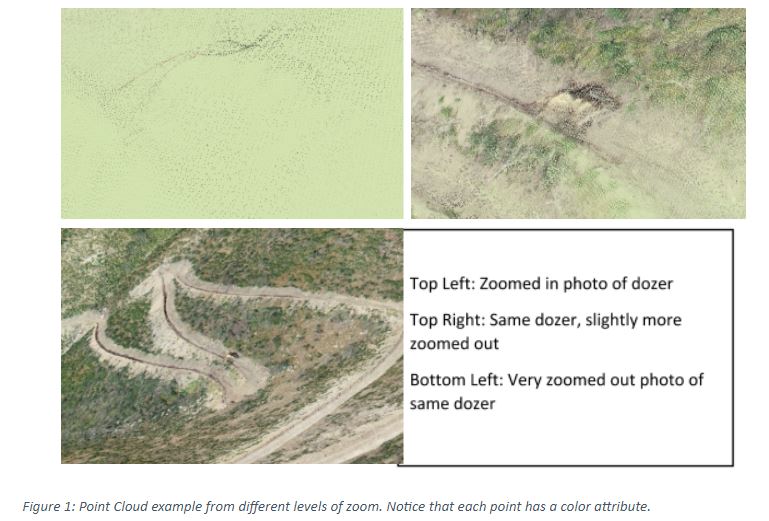
Surface files can come from aerial mapping, usually by photogrammetry or lidar techniques. Data can be obtained via public sources like Google Earth, but data is typically not as accurate as photogrammetry or especially lidar. Burgex has the ability to perform aerial mapping via photogrammetry.
Photogrammetry works by matching up pixels from different photos with different geotags and camera angles. By having an overlap of about 70%, powerful software can match up thousands of pixels to get an orthophoto, then a point cloud to build a colored 3D surface model of the ground.
LiDAR works by sending out thousands of light signals, which reflect off surface points like the ground, buildings, and vegetation, and come back to the sensor. The sensor can then measure the time taken for the light to be transmitted and return to determine accurate X, Y, and Z locations of millions of points.
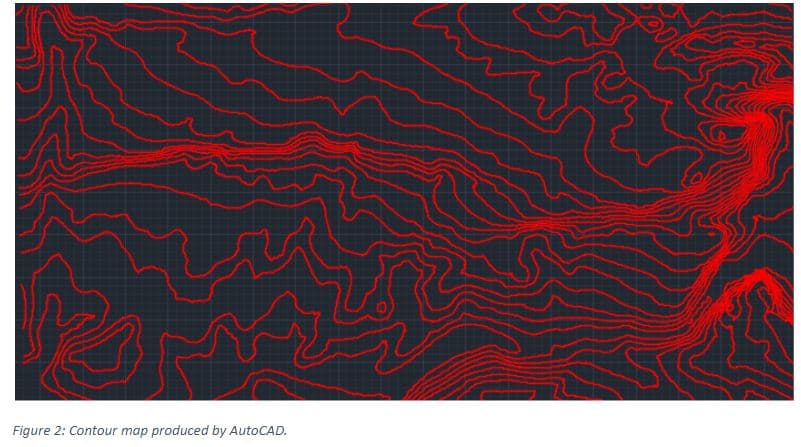
Once a surface file is created, that surface can be imported into AutoCAD. AutoCAD can also create a surface from points. If it is easier to obtain points with Northing, Easting, and Elevation data, the engineer can build a surface and contour map within AutoCAD.
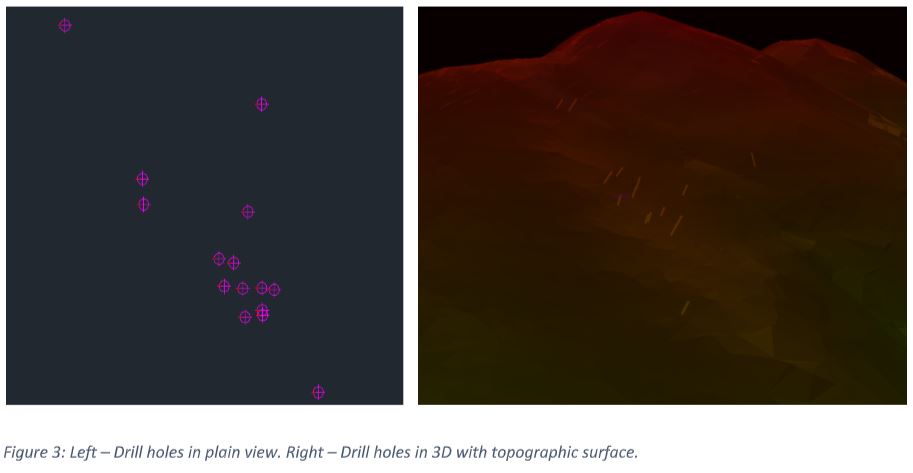
With the surface now created, the drill holes can be imported.
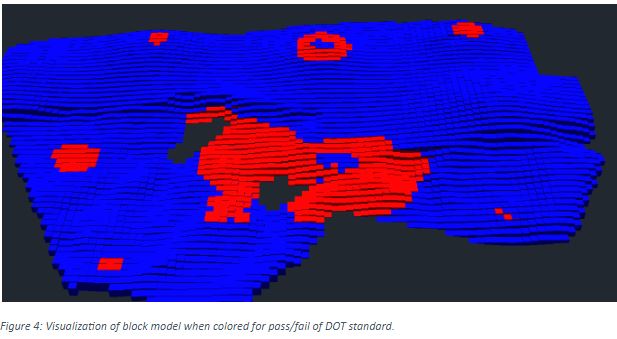
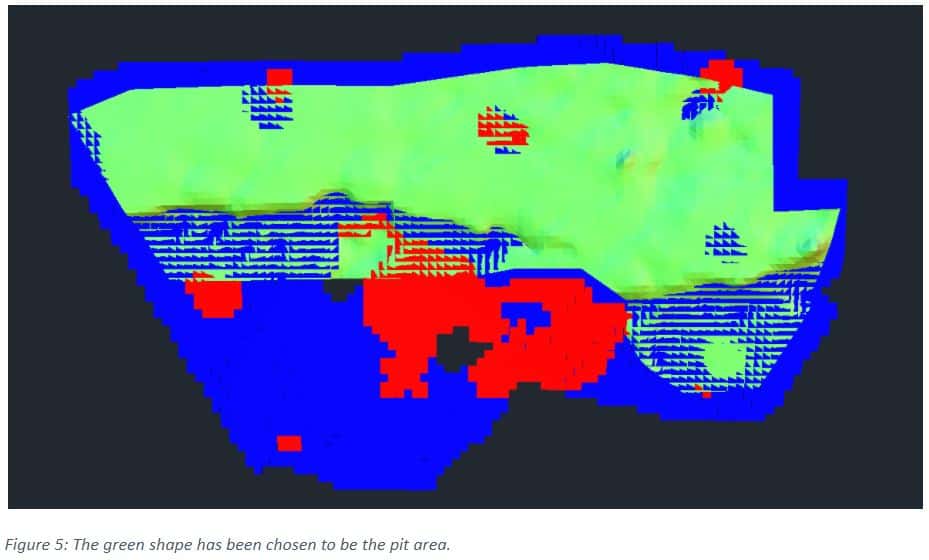
After drill holes are imported, a block model is created to separate ore grades. For the example below, the block model is created to show sections of the block model that would pass a specific state’s Department of Transportation (DOT) standard for LA Abrasion, Soundness, and Specific Gravity (the aggregate tests determine suitability for DOT use). The colors are automatically generated by defining the grade parameters within the software. When a block passes all three standards, it is given a blue, and when any or all of the standards fail, it is given a red.
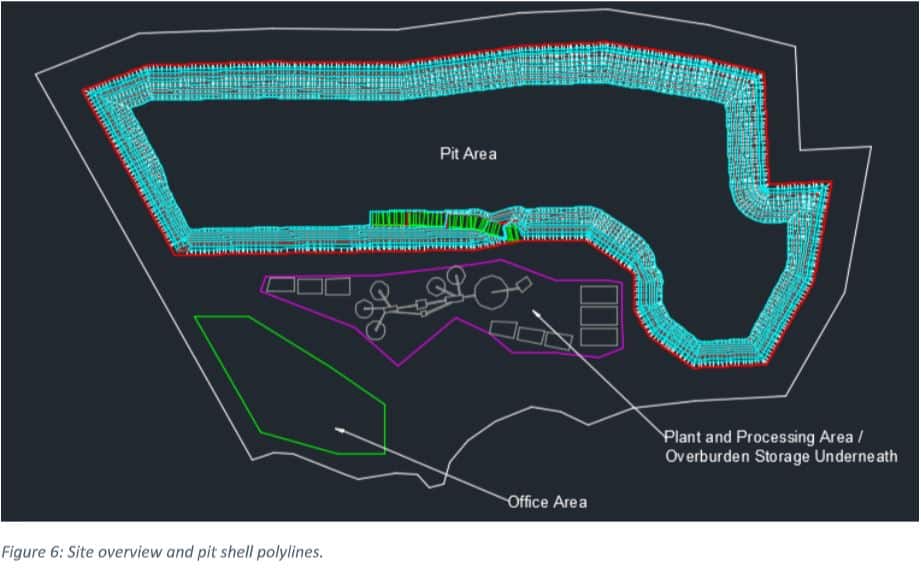
The block model can then be used to determine where the pit area will be located, assuming there are no other site-specific issues that hinder that placement. This is helpful so that only the ore/rock that meets the criteria is mined. For this example, the pit has been designed to avoid the large area of low-quality stone. The plant and processing area will be built on the low-quality area.
When the pit location is determined, the rest of the site can be laid out. The site layout and mine plan may need to be adjusted later after the overburden is calculated or if the pit needs to change for one reason or another. Engineers can run many iterations of different site layouts and can design the site layout in such a way to maximize the area used to avoid unnecessary costs. Typically, the mine plan takes into consideration the overburden depths, as well as the rock qualities, to determine when the pit will be situated. The mine design layout can then generate a 3D pit shell, and volume quantities can be calculated. This is done by selecting a polyline for the pit extents, and inputting several options into command, including, but not limited to: bit bottom elevation or surface file, haul road included and which direction into the pit, road width, and max decline angle, the number of benches and depths, etc.
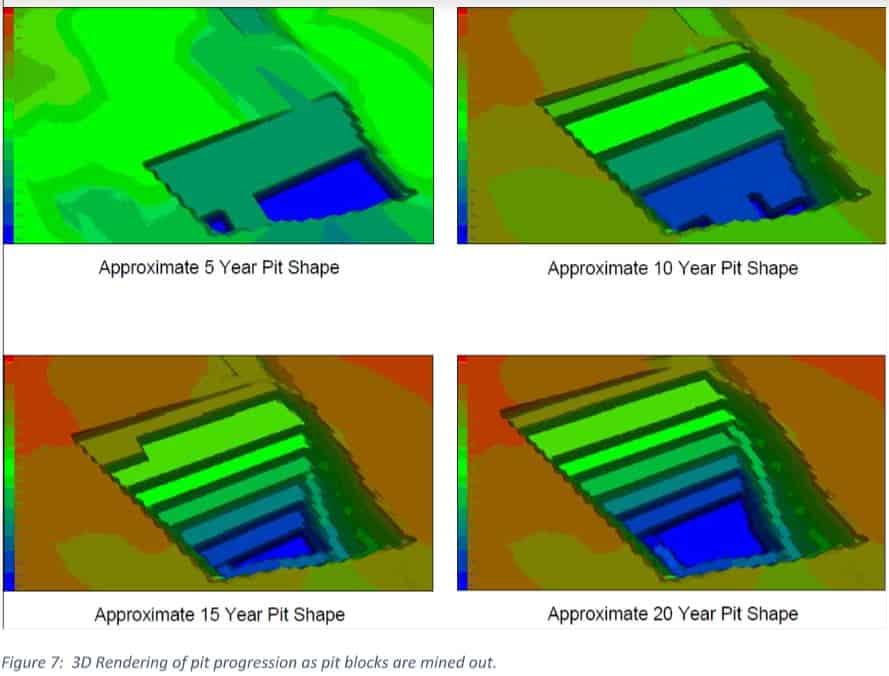
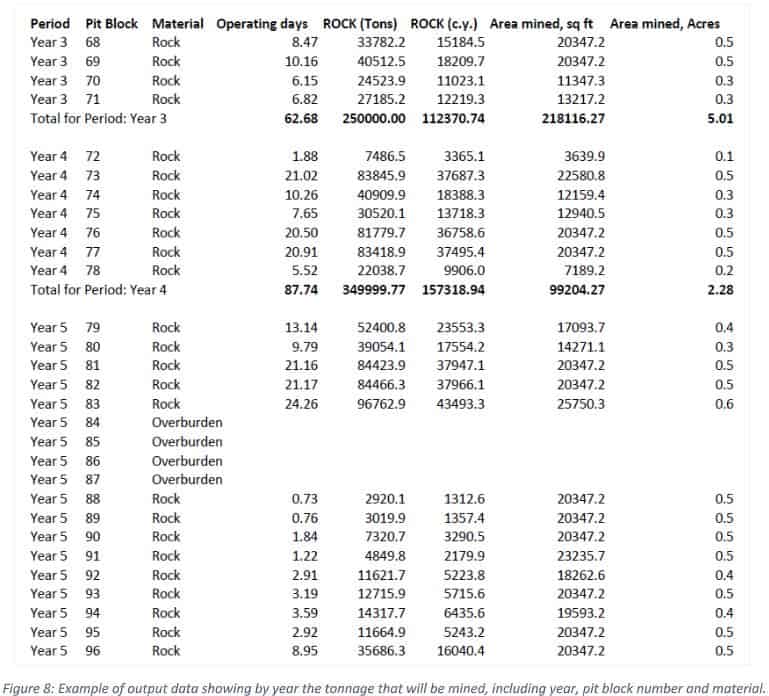
Then, to schedule the mine plan, the pit shell needs to be broken into multiple small pits. This can be done in several ways, including by advance, by width, rate, etc. Doing this allows the scheduling to be broken into years, months, weeks, and even days. Many inputs go into the scheduling as well. Some important information to consider would be the equipment to be used (including mining production equipment and processing equipment), the number of hours each shift will work, the number of shifts per day that will be worked. The engineer can then schedule the mine by selecting those advances in the order they will be mined. This allows the engineer to shape the pit as mine continues, avoid certain areas, or my certain areas before others. As mentioned above, the equipment and shift details are built into the program to calculate timing better.
The pit progression can be viewed in 3D to visualize pit shape better, and many data outputs are available.
Carlson software has a database for common equipment used in mining already built into the program. The mining engineer can use this database to see how mining rates will change based on the equipment used to mine. The engineer must indicate the road network that will be used, and this network will be established as a road system in Carlson; then, cycle times can be calculated to and from anywhere on the site. The engineer will choose the truck to be used (most CAT off-highway trucks are already in the database), and the number of trucks to be used, and the software will calculate the production rate for the fleet. It is easy to change the equipment type to see the difference between fleets. For example, it is simple to select your start and endpoints, and choose two (2) CAT 775 trucks to see what the production will be for that fleet, then change that same route to three (3) CAT 773 trucks to see how the product will change per hour. Once the fleet is chosen, a schedule can be built out for the life of mine (LOM).
Using all the AutoCAD data, Burgex knows exactly how much material needs to be moved and how much product can be sold. This data is used in Cost Models and Cash Flow Models to financially evaluate a project. In most cases, designs can be redrawn in several ways to get the desired outcome. Sometimes, site-specific conditions force the layout to be drawn in a specific manner (i.e., wetlands, site access, transportation routes, etc.).
When the mine plan is finished and has been technically reviewed internally by Burgex, the mining engineer will create easy to read maps to show the mine design and pertinent information for the client.